Commands
arc()
Syntax
arc(x, y, radius, range=None, ccw=False, close=False, plot=True, **style)
Description
Draws a full circle or partial arc centered at (x,y). The range argument allows you to draw only a portion of the circle. It can be either a number defining the angle (from 0°) or a 2-tuple with a start- and stop-angle. By default the endpoints of the range will be connected in a clockwise direction, but this can be inverted by passing ccw=True. If the close argument is set to True, the endpoints of the arc will be connected via a pie-slice through the origin.
Returns
Tutorial
Example

fill(.9)
arc(125,125, 125)

fill(.2)
arc(40,40, 20)

nofill()
stroke(.2)
arc(60,60, 40, range=180)
arc(60,60, 30, range=90, ccw=True)
stroke('red')
arc(60,60, 20, range=270, close=True)
image()
Syntax
image(src, x, y, width=None, height=None, plot=True, **style)
image(x, y, width=None, height=None, src="path-or-url", plot=True, **style)
image(x, y, width=None, height=None, data="bytes-or-base64", plot=True, **style)
Description
Draws an image to the screen, optionally scaling and compositing it in the process.
The src parameter can be a string (containing the path to an image file), another Image object, or even the global canvas object. The optional data parameter can be used in lieu of src to supply image data as either a stream of raw bytes from an image file or a base64-encoded string (prefixed with the characters "base64,").
The x and y parameters set the location of the image’s upper left corner. The width and height parameters are optional and define the maximum width and height of the image. The image will be scaled to fit within the given width and height while maintaining its aspect ratio. The command also accepts optional alpha and blend keyword arguments which set the opacity and blend-mode for compositing the image.
As with other primitives, setting the plot parameter to False will return a drawable object but not add it to the canvas.
Returns
an Image object that can be passed to background(), fill(), clip(), mask(), and plot() among others.
Example
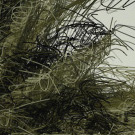
image("superfolia.jpg", 0, 0)
line()
Syntax
line(x1, y1, x2, y2, plot=True)
Description
Draws a line-segment to the screen – a straight path between two points. The first pair of parameters sets the location of the ‘origin’ point and the following pair sets the location of the ‘destination’ point.
You will only be able to see the line segment if the stroke() is different from the current background() color. Also note that lines will not be drawn if the stroke() is set to None.
Returns
Tutorial
Example

pen(2)
stroke(0.2)
line(10, 20, 80, 80)
oval()
Syntax
oval(x, y, width, height, plot=True, **style)
Description
Draws an ellipse to the screen. The x and y parameters set the location of the oval’s top-left ‘corner’. The third parameter sets the width, and the fourth sets the height (i.e., setting them to the same value will yield a circle).
Returns
Tutorial
Example
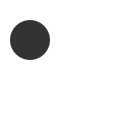
fill(0.2)
oval(10,20, 40,40)
poly()
Syntax
poly(self, x, y, radius, sides=4, points=None, plot=True, **style)
Description
Draws an n-sided convex polygon (by default a square) centered at (x,y) and sized according to radius. The sides argument sets the type of polygon to draw. Absent any rotate() transformations, the shape will be oriented such that its base is horizontal.
If you include a points argument (in lieu of sides), a concave ‘star’ polygon with regularized angles will be drawn instead.
Returns
Tutorial
Example
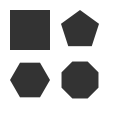
fill(.2)
poly(30,30, 20)
poly(80,30, 20, sides=5)
poly(30,80, 20, sides=6)
poly(80,80, 20, sides=8)
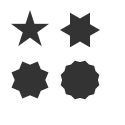
fill(.2)
poly(30,30, 20, points=5)
poly(80,30, 20, points=6)
poly(30,80, 20, points=8)
poly(80,80, 20, points=12)
rect()
Syntax
rect(x, y, width, height, roundness=0.0, radius=None, plot=True, **style)
Description
Draws a rectangle with a top-left corner of (x,y) and size of (width, height).
The roundness arg lets you control corner radii in a size-independent way. It can range from 0 (sharp corners) to 1.0 (maximally round) and will ensure rounded corners are circular.
The radius arg provides more-precise control over corner-rounding. It can be either a single number (specifying the corner radius in canvas units) or a 2-tuple with the radii for the x and y axes respectively.
Returns
Tutorial
Example
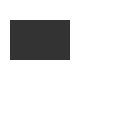
fill(0.2)
rect(10, 20, 60, 40)
text()
Syntax
text(str, x, y, width=None, height=None, outline=False, plot=True, **options)
Draw a string at x/y (while optionally setting its maximum width and height)
text(x, y, width=None, height=None, str="", **options)
The string can be omitted as the first arg if provided as a keyword argument
text(x, y, width=None, height=None, xml="", **options)
If an xml string is passed as a keyword argument, its tags will be accessible through the select() method and the tag names will be mapped to font definitions in the stylesheet()
text(x, y, width=None, height=None, src="<path or url>", **options)
Load the file pointed to by the src argument and draw its contents
Description
Draws text to the screen, either as a single line or a multi-line block. The first parameter is a string of unicode text to display. The x & y parameters set the location of the text’s baseline. The optional width parameter specifies the column-width for a multi-line textblock and, if present, the height parameter sets maximum height for the column. Text in a column is wrapped across as many lines as will fit in the maximum height.
Text will be drawn using the current font() and layout() style, but individual settings can be overridden by passing new values as keyword arguments (the text() command supports all the same keyword arguments that font() and layout() provide). For instance, the text’s alignment can be set with the layout() command or the optional align keyword argument.
Text will be drawn in the current fill() color, but will not reflect the global pen() and stroke() unless drawn as an outline. If the current fill() is a multi-color gradient, text() will use the first color in its range (unless outlined, in which case it will use the gradient fill).
By default, text is not outlined (which may not be what you want when exporting to PDF). To ‘trace’ the text into outlines, call text() with outline=True. This will convert the text to a Bezier before adding it to the canvas. Also consider using the textpath() convenience function.
Inline Style Markup
By default, text() will render the entire str argument in a single style (based on the canvas’s current font(), layout(), and fill() state). You can selectively style portions of the string if you format it as XML and use the stylesheet() command to define styles for the tags you use in the markup. Stylesheet definitions behave similarly to CSS declarations in that more deeply nested styles will override attributes of less deeply nested ones.
Note that for PlotDevice to recognize your string as XML it must be passed as the xml keyword argument – passing it as the first positional argument will display the raw markup verbatim.
The string you pass must be ‘valid’ XML, in particular you must escape the control characters: &, <, >, ', and ". Also note that any attributes you add to your tags must be wrapped in double-quotes. PlotDevice diverges from strict XML in two ways:
- your string does not need to be wrapped in a root element or include any XML-declaration/doctype boilerplate
- whitespace and line breaks are significant: each ‘line’ of the string will be typeset as a single, word-wrapped paragraph.
When drawing an XML string, text() will ignore any tags that don’t correspond to a definition in the stylesheet(). Tags that don’t correspond to styles can still be useful though since their character location, layout, and attribute data can be retrieved from the TextMatch objects returned by Text.select().
Reading Text from Files and URLs
If you pass a src keyword argument to text(), PlotDevice will treat it as either a file path or (if it begins with "http://" or "https://") a URL to be fetched. If the file name ends with ".xml", the contents will be parsed for inline styling; otherwise the text read from the file will be displayed without further processing.
Optional Parameters
family
weight
size
italic
variant
face
tracking
You can override the current character-style for an individual text() invocation by including any of the keyword arguments supported by the font() command.
lig
sc
osf
tab
vpos
frac
ss
The current OpenType Feature settings from prior calls to the font() command may also be overridden for an individual text() call.
align
hyphenate
margin
indent
leading
spacing
Likewise, the current paragraph-style settings can be overridden for an individual text() invocation by including any of the layout arguments supported by layout().
style
If you have defined text styles using the stylesheet() command, you can select one by passing a style-name as the style argument. The selected style will be applied to the entire run of text (so use inline markup if you need greater granularity).
plot
By default, the text() command will render to the canvas immediately. Passing plot=False will return the rendered Text or Bezier object without adding it to the canvas.
Returns
Tutorial
Example

fill(0.2)
font("Helvetica", 20)
text("hello", 10,50)
text("goodbye", 10,70, italic=True)
Legacy Commands
arrow()
Syntax
arrow(x, y, width, type=NORMAL, plot=True, **style)
Description
Draws an arrow to the screen. The first two parameters set the location (measured from the arrow’s head), the third sets the width. Optionally you can define the arrow type with the fourth parameter. By default the arrow type is NORMAL, but there is also a trendier FORTYFIVE version.
Returns
Tutorial
Example
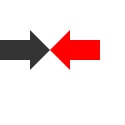
fill(0.2)
arrow(50, 50, 50)

rotate(180)
fill('red')
arrow(50, 50, 50)
star()
Syntax
star(x, y, points=20, outer=100, inner=50, plot=True, **style)
Description
Draws a star to the screen. The x and y parameters set the location of the star’s center. There are three optional parameters that set the number of points, the outer radius and the inner radius.
If the inner radius is omitted, it will be set to half of the outer radius.
Returns
PlotDevice Equivalent
The poly() command can draw either convex polygons or stars with regularized angles. When calling poly(), include a points argument to set the number of points in the star.
Tutorial
Example

fill(.75)
star(50,50, 16, 50,25)

fill(0.2)
star(50,50, 8, 50)