Commands
color()
Syntax
color(mode=RGB, range=1.0) # the default color mode and range
color(range=255)           # use 0-255 component values rather than 0–1
color(HSV)                 # color-related commands will expect HSV values
Update the graphics state’s ‘current’ color mode
color(r, g, b, a=1)    # RGB mode
color(h, s, v, a=1)    # HSV mode
color(c, m, y, k, a=1) # CMYK mode
Create a Color object using the current color mode
color(v, a=1)
Create a greyscale Color object (regardless of the current mode)
Color State
A number of plotdevice commands can take lists of numeric arguments to specify a color (see stroke(), fill(), background(), etc.). When called with keyword arguments alone, The color() command allows you to control how these numbers should be interpreted in subsequent color-modification commands.
By default, color commands interpret groups of 3 or more numbers as r/g/b triplets (with an optional, final alpha arg). If the mode keyword arg is set to RGB, HSV, or CMYK, subsequent color commands will interpret numerical arguments according to that colorspace instead.
The range keyword arg sets the maximum value for color channels. By default this is 1.0, but 255 and 100 are also sensible choices.
For instance here are three equivalent ways of setting the fill color to ‘blue’:
color(mode=HSV)
fill(.666, 1.0, .76)
color(mode=RGB, range=255)
fill(0, 0, 190)
color(mode=CMYK, range=100)
fill(95, 89, 0, 0)
Color mode & range changes can be constrained to a block of code using the with statement. e.g.,
background(.5, .5, .6) # interpteted as r/g/b (the default)
with color(mode=CMYK): # temporarily change the mode:
    stroke(1, 0, 0, 0) # - interpteted as c/m/y/k
fill(1, 0, 0)          # outside the block, the mode is restored to r/g/b
Making Colors
When called with a sequence of color-channel values, color() will return a reusable Color object. These can be passed to color-related commands in lieu of numeric args. For example:
red = color(1, 0, 0)                   # r/g/b
glossy_black = color(15, 15, 15, 0.25) # r/g/b/a
background(red)
fill(glossy_black)
You can also prefix the numeric args with a color mode as a convenience for setting one-off colors in a mode different from the current colorspace:
color(mode=HSV)                        # set mode to h/s/b
hsb_color = color(.7, 1, .8)           # uses current mode (h/s/b)
cmyk_color = color(CMYK, 0, .7, .9, 0) # interpreted as c/m/y/k
still_hsb = color(1, .5, .25)          # uses current mode (h/s/b)
Greyscale colors can be created regardless of the current mode by passing only one or two values (for the brightness and alpha respectively):
fill(1, .75) # translucent white
stroke(0)    # opaque black
If you pass a string to a color command, it must either be a hex-string (beginning with a #) or a valid CSS color-name. The string can be followed by an optional alpha argument:
background('#f00')   # blindingly red
fill('#74e9ff', 0.4) # translucent pale blue
stroke('chartreuse') # electric bile
Returns
Tutorial
fill()
Syntax
fill(r, g, b, a=1.0)
fill(h, s, v, a=1.0)
fill(c, m, y, k, a=1.0)
fill(v, a=1.0)
fill(color)
fill(*colors, angle, steps=[0,1]) # axial gradient
fill(*colors, steps=[0,1], center=[0,0]) # radial gradient
Description
Sets the current fill color, interpeting the arguments according to the canvas’s current color-mode and range. For details see the color() command.
If more than one color arg is included, a gradient will be drawn. Pass a list with the steps keyword arg to set the relative location of each color in the gradient (0-1.0). The relative locations are based on the bounding-box of the object being filled (not its convex hull). So for highly rounded objects, you’ll need to adjust the steps to account for the dead-space in the corners of the bounds.
Including an angle keyword arg will draw a linear gradient at that orientation (otherwise it will be radial). Radial gradients will draw from the object center by default, but a relative center can be specified with the center keyword arg. If included, the center arg should be a 2-tuple with x,y values in the range -1 to +1.
In addition to colors, you can also call fill() with an image() as its sole argument. In this case the image will be tiled to fit the object being filled.
Returns
Tutorial
Example
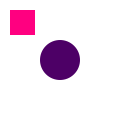
fill(1.0, 0.0, 0.5)
rect(10, 10, 25, 25)
fill(.3, 0.0, 0.4)
oval(40, 40, 40, 40)
pen()
Syntax
pen(nib, join=MITER, cap=BUTT, dash=None)
Description
Sets the line-style to be used when a stroke() color has been set. The nib argument sets the width of the stroke in terms of the units set in size() (points by default). The cap argument controls how endpoints of beziers are drawn: BUTT, SQUARE, or ROUND. Vertices within a bezier are controled by the join arg and can be set to MITER, ROUND, or BEVEL.
If the dash argument is not None, it must be either a single number or a list of them specifying on-off intervals for drawing a dashed line
Returns
a context manager allowing pen changes to be constrained to the block of code following a with statement.
Tutorial
Example
nofill()
stroke(0.2)
pen(1.5)
rect(10, 10, 20, 40)
pen(3)
rect(40, 10, 20, 40)
nofill()
stroke(0)
pen(10, cap=BUTT)
line(20,20, 50,20)
with pen(cap=ROUND):
    line(20,40, 50,40)
with pen(cap=SQUARE):
    line(20,60, 50,60)
with nofill(), stroke(0), pen(10):
    pen(join=MITER)
    bezier([(20,20), (40,40), (60,20)])
    pen(join=ROUND)
    bezier([(20,50), (40,70), (60,50)])
    pen(join=BEVEL)
    bezier([(20,80), (40,100), (60,80)])
stroke()
Syntax
stroke(r, g, b, a=1.0)
stroke(h, s, v, a=1.0)
stroke(c, m, y, k, a=1.0)
stroke(v, a=1.0)
stroke(color)
Description
Sets the stroke color used when drawing lines around shapes, paths, and text. All drawing operations following a call to stroke() will be outlined in the specified color (with a ‘nib’ width set via the pen() command).
The color is specified in terms of RGB, HSV or CMYK depending on the canvas’s current color-mode and range. For details see the color() command. To disable stroke-drawing either call stroke() with None or use the nostroke() convenience method.
Returns
Tutorial
Example
nofill()
strokewidth(3)
stroke(0.3, 0.0, 0.4)
rect(10, 10, 20, 40)
stroke(1.0, 0.0, 0.5)
rect(40, 10, 20, 40)
Objects
Color
Syntax
Color()
Description
Methods
clr.blend(clr2, factor)
clr.copy()
The blend() method returns a new color that is a mixture of the object and another Color object. Set the factor argument to a value between 0 and 1.0 to control the proportions used for mixing the colors.
Properties
clr.r # .red
clr.g # .green
clr.b # .blue
clr.a # .alpha
clr.h # .hue
clr.s # .saturation
clr.v # .value (or .brightness)
clr.c # .cyan
clr.m # .magenta
clr.y # .yellow
clr.k # .black
clr.hex  # a string like "#f00" or '#ff0000'
clr.hexa # a tuple like ("#aa99ff", .75)
See the tutorial on colors to learn more about Color objects and their uses.
Gradient
Syntax
Gradient(*colors, steps=[0,1], angle=0)
Linear gradient
Gradient(*colors, steps=[0,1], center=[x,y])
Radial gradient
Description
A linear or radial gradient that can be used in any context that expects a Color (e.g., fill(), stroke(), background(), etc.). The steps list must have the same length as the number of colors and describes proportionally (in the range 0.0–1.0) where each color transition happens.
Properties
g.brightness
Methods
g.fill(tuple(x, y, width, height))
g.fill(Bezier)
g.copy()
Shadow
Syntax
Shadow(color, blur=10, offset=(5,5))
Description
A drop-shadow which can be passed to the shadow() command.
Properties
s.color
s.blur
s.offset
Methods
s.copy()
Legacy Commands
capstyle()
Syntax
capstyle(style)
Description
Defines how endpoints of a path should be rendered. The style argument must be one of: BUTT (the default), ROUND, or SQUARE. Note that the latter two styles extend the length of the path to add the endcaps.
PlotDevice Equivalent
The pen() command allows you to set the linecap style using its cap argument.
Tutorial
Example
fill(None)
stroke(0)
strokewidth(10)
capstyle(BUTT)
line(20,20, 50,20)
capstyle(ROUND)
line(20,40, 50,40)
capstyle(SQUARE)
line(20,60, 50,60)
colormode()
Syntax
colormode(mode, range=1.0)
Description
Changes the way PlotDevice interprets color values. By default, fill() and stroke() expect values between 0.0 and 1.0 using the RGB color model. RGB corresponds to Red/Green/Blue. Alternatively HSV (Hue/Saturation/Brightness) or CMYK (Cyan/Magenta/Yellow/Black) can be specified.
Regardless of the active colormode, PDFs and images are exported in the specified outputmode().
The optional range parameter specifies whether color values are defined between 0.0 and 1.0, or something else, 0 and 255 for example:
colormode(range=255)
Returns
the current color mode (RGB, CMYK or HSV)
PlotDevice Equivalent
The mode used for interpreting color values is now set through the color() command. Color-related commands like fill(), stroke(), and background() can also take a mode as their first argument, specifying how the numerical args should be interpreted.
Tutorial
Example
colormode(RGB)
fill(0.25, 0.25, 0.25)
rect(10, 10, 40, 40)

colormode(HSV)
fill(0, 0, 0.25)
rect(60, 10, 40, 40)
joinstyle()
Syntax
joinstyle(style)
Description
Defines how vertices in a path should be rendered. The style argument must be one of: MITER (the default), ROUND, or BEVEL.
PlotDevice Equivalent
The pen() command allows you to set the linejoin style using its join argument.
Tutorial
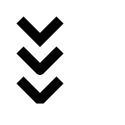
Example
fill(None)
stroke(0)
strokewidth(10)

joinstyle(MITER)
bezier([(20,20), (40,40), (60,20)])

joinstyle(ROUND)
bezier([(20,50), (40,70), (60,50)])

joinstyle(BEVEL)
bezier([(20,80), (40,100), (60,80)])
nofill()
Syntax
nofill()
Description
Disables the current fill color. All shapes, paths and text following this command will be drawn without a fill color. Calling nofill() is equivalent to fill(None).
Tutorial
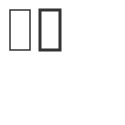
Example
strokewidth(1.5)
stroke(0.2)
fill(0.2)
rect(10, 10, 20, 40)
nofill()
rect(40, 10, 20, 40)
nostroke()
Syntax
nostroke()
Description
Disables the current stroke color. All shapes, paths and text following this command will be drawn without a stroke (outline) color. Calling nostroke() is equivalent to stroke(None).
Tutorial
Example
fill(0.2)
strokewidth(6)
stroke(1.0, 0.0, 0.5)
rect(10, 10, 20, 40)
nostroke()
rect(40, 10, 20, 40)
strokewidth()
Syntax
strokewidth(width)
Description
Sets the width of the stroke used for lines around shapes, paths and text.
Returns
PlotDevice Equivalent
The pen() command allows you to set the stroke width using its nib keyword argument or simply by passing the new width as its first positional arg.
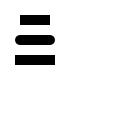
Example
nofill()
stroke(0.2)
strokewidth(1.5)
rect(10, 10, 20, 40)
strokewidth(3)
rect(40, 10, 20, 40)