Your PlotDevice scripts can generate not only static images, but animations as well. Animations can be previewed on-screen then exported as QuickTime movies, animated GIFs or sequentially named image files. With the same syntax used for drawing, your script can become an animation doing all kinds of wonderful, lively things.
Basic Animations
For PlotDevice to recognize your script as an animation, simply define a function called draw() somewhere in your code. This function will be called repeatedly; once for each frame in the animation.
You can optionally call the speed() command with a frames-per-second value. This sets a target playback speed for showing your animation in the app’s output pane. But depending on the speed of your system and the complexity of your code, the actual frame rate may well be lower.
To track the passage of time, read from the global FRAME variable. It starts at 1 and increments with each call to your draw() function. You’ll likely want to keep more local state than this (and you can; see below), but it’s surprising how much variety you can pull out of just the frame-number. In particular, try using the ever increasing FRAME with trigonometry functions and watch how the oscillations evolve over time:
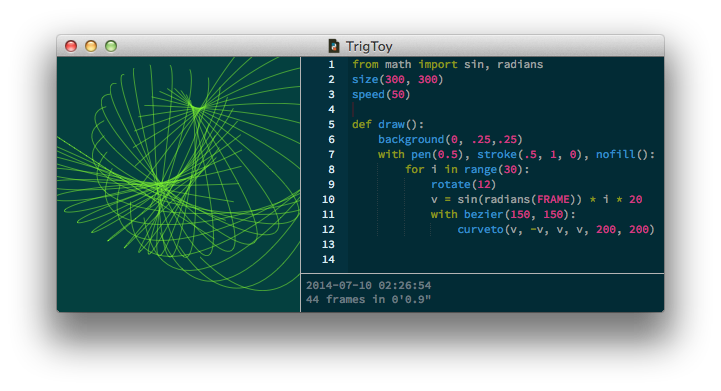
The script begins normally, with a call to size(). After setting the animation speed() to 50 FPS we define a draw() function that does basically four things:
- Set the background color
- Set the fill, stroke, and pen styles
- Draw thirty rotated curves
- Use the math module’s sine function to distort the curves fluidly
Fluid movement
Our draw() method makes use of the sin() function from the Python math module. A sine is an oscillating function that yields values from -1.0 to 1.0 (then back down to -1.0), but not in a linear fashion. When near to -1 or 1 the value changes slowly, then goes faster as it crosses 0. This is useful for animation that ‘eases’ in or out.
To use the sin() function, import it from the Python math package along with the radians() function (sines work with multiples of π). Our draw() function passes the FRAME variable (as radians) to the sin() function then multiplies the sine by a differnt number for each curve. This produces a fluid distortion vector that eases each curve back and forth.
A sine function typically looks like this:
from math import sin, radians
ease = sin(radians(x)) * y
The Animation Lifecycle
You’ll notice that the TrigToy script calls rotate() repeatedly in the for loop and yet this doesn’t carry over to subsequent frames. This is because after each of the calls to draw(), PlotDevice automatically clears the canvas and resets the color, transform, font, and compositing state (though the canvas size & background color will be preserved).
In addition to this housekeeping between frames, PlotDevice also provides hooks to allow your script to execute code once at the beginning of a ‘run’ and once at the end. You can opt-into this behavior by defining a setup() function to handle initialization and/or a stop() function to clean up after the user hits to halt the animation.
Altogether, the sequence of a run looks something like:
- Execute all code at the script’s top indentation-level
- Call the setup() function (if defined)
- Clear the canvas and reset the graphics state to defaults
- Call the draw() function and plot its output to the screen
- If user didn’t press goto #3
- Call the stop() function (if defined)
Global state
For all but the simplest animations you’ll want a way to keep track of values that persist between calls to your draw() function. The most obvious solution to this problem would be to define global variables at the top of your script, then refer to them from your animation functions. If you do this, don’t forget to use the Python global statement inside any of the functions that need to modify a variable. Otherwise you’ll end up creating a local variable of the same name rather than updating the global:
limit = 0

def setup():
    global limit
    limit = 100 # global is required for assignment to work

def draw():
    global limit
    limit -= 1 # likewise for value overwriting

def stop():
    print(limit) # no need to use global here since we're only reading
Animation state
If the oddities of Python’s global scope start getting you down, PlotDevice also offers an alternate way to share data between invocations of setup(), draw(), and stop(). If your function definitions include an argument, they will be passed a dictionary-like object that persists throughout the run. You can name this object anything you like and access its fields using either dot-notation or traditional dictionary indexing.
This allows for a program-flow in which:
- setup() populates the dictionary
- draw() uses those initial values and potentially updates them
- stop() can print out summary information based on the final values
Here’s an example that draws random dots for a fixed duration of frames each. It keeps track of the current ‘population’ of dots in a persistent dictionary called anim, though of course we could give this any name we like.
With each call to draw() a new random dot location and color are added to a persistent list called anim.dots, then a circle is drawn for each dot in the list. Dots will gradually fade over the course of their lifetimes as we incrementally turn down the alpha in the saved Color objects.
If draw() has been called enough times that the list is longer than the anim.limit chosen in setup(), elements are dropped off the front until it’s the right length.
speed(30)

def setup(anim):
    anim.dots = []
    anim.limit = 100

def draw(anim):
    x, y = random(WIDTH), random(HEIGHT)
    dotcolor = color(HSV, random(), .6, .9)
    anim.dots.append([x, y, dotcolor])

    for x, y, clr in anim.dots:
        clr.alpha -= 1.0/anim.limit
        fill(clr)
        arc(x, y, 20)
    anim.dots = anim.dots[-anim.limit:]

def stop(anim):
    print("Final population:", len(anim.dots))
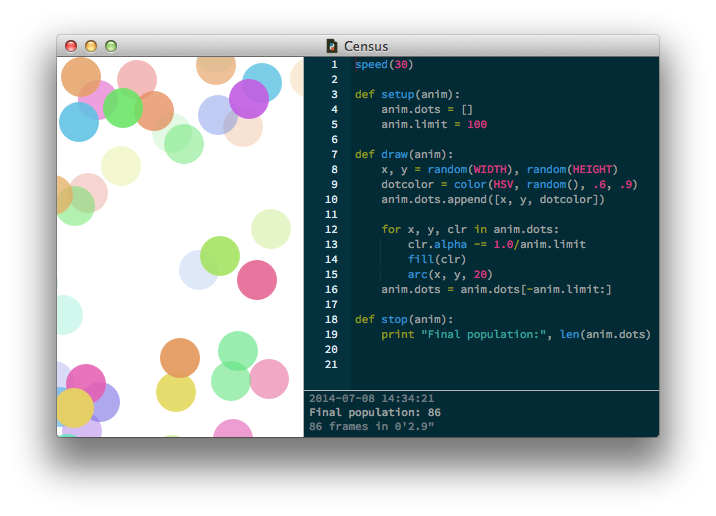
Since this run was halted after 86 frames, the stop() function reports having an identical number of items in its dots list. What would you expect it to print out if the animation ran for 100 frames? What about 101 or 1,000,000?
Bailing out
PlotDevice animations typically run in an open-ended fashion – new frames will be generated until you hit to end the run. You’ll occassionally want more direct control over this, particularly when debugging. There are a couple of ways to prevent an animation from galloping away from you.
The first is a special case of the speed() command. If you call it with an FPS of zero, only a single frame will be drawn before the animation halts itself:
speed(0)
The second way to cut off an animation is to call the halt() command from within your draw() method. For instance, here’s how you’d limit an animation to a dozen frames:
def draw():
    ... # normal drawing code
    if FRAME==12:
        halt()
Tips for speed optimization
- If you plan to use a lot of lines in your animation, group them into a single path by using the bezier() command as part of a
withstatement and calling line() or lineto() & moveto() within the block. A single big path renders faster than many small paths. But keep in mind that all the lines in the path will have the same stroke color and width. - If you plan to use a lot of text in your animation, create cached textpath() versions in your setup() routine and translate() those when drawing instead of repeatedly calling text() in the draw() command.
- Don’t get too irrationally exuberant with the speed() command. Cranking it up is often counterproductive since PlotDevice will attempt to update the screen faster than the hardware can support. In particular, if you’re not using a CRT there’s basically no reason to go above 60 Hz.
- Tune the size() of the canvas to exactly what you
need – a smaller canvas means less screen to refresh.
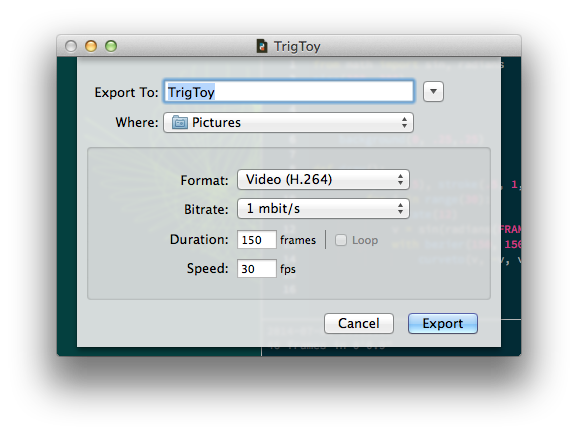
Exporting an Animation
In addition to exporting frames as static images, you can export an animation as an H.264-encoded Quicktime movie or an animated GIF. Select the menu or press . You can specify a number of frames to export and a frame rate (which will override whatever you set with speed()). Video exports also allow you to set a target bitrate to control compression quality. Animated GIFs will loop if the checkbox is selected.